Create Your Matplotlib Style Sheet in 10 minutes
Are you tired of writing the same lines of code to prettify your matplotlib every time you make a plot? Are you trying to find a semi-productive activity to delay returning to your actual responsibilities for another 10 to 15 minutes?
If the answer the either or both of these questions is, LET’S MAKE A STYLE SHEET!
Step 1: What’s a style sheet?
It pretty much does what it says on the tin: it tells matplotlib how to “style” your plot. You can specify anything from the size of the labels to the colour of the axes or the background.
Matplotlib already has a number of style sheets you can use, I’m putting a few example below but check the documentation if you are interested (docs)


How do you use it you ask? Here’s an example for the ggplot style sheet.
import matplotlib.pyplot as pltplt.use.style('ggplot') Step 2: How to make your own
To make your own, it’s very simple!
Create a file with the extension .mplstyle
Read the 600 line matplotlibrc sample file to find which parameters you’d like to change.
What? Don’t feel like spending an hour picking out parameters to style?
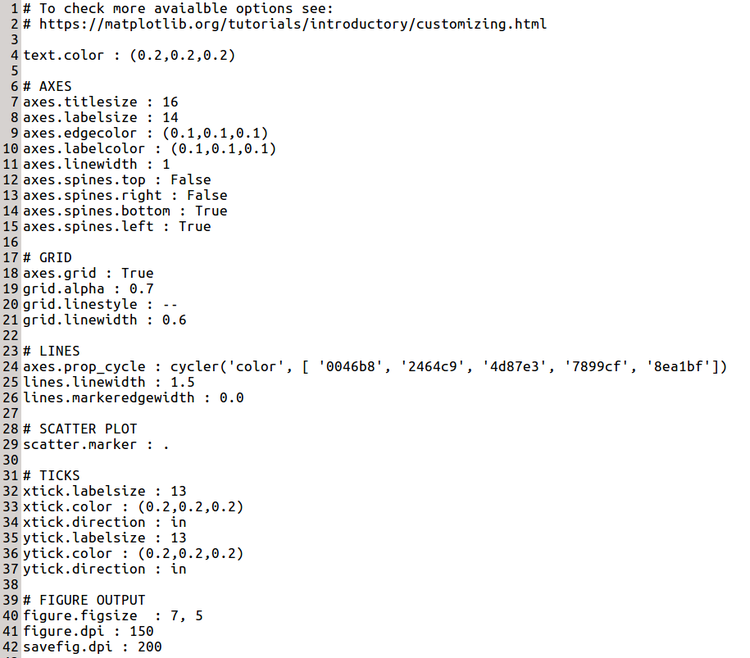
Fine, check this out (explanation below):
First things first, what does this do to our plots?
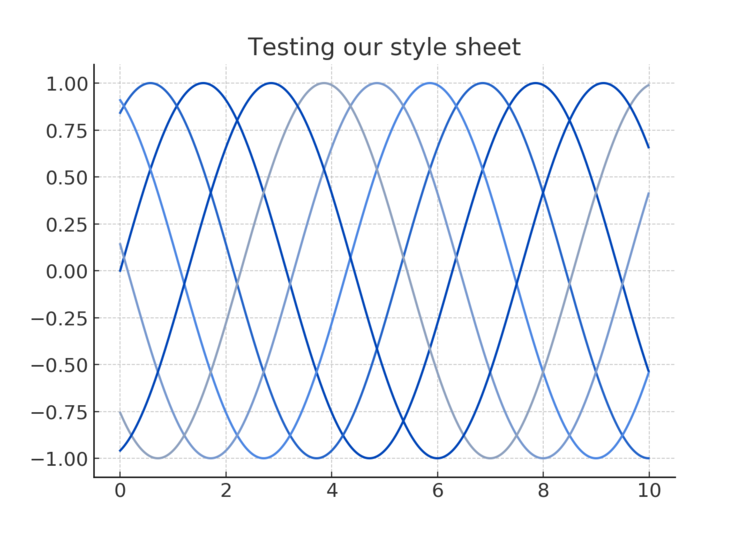
I like it, then again, I made it.
If you want to change it after downloading it, most of the parameters in this style file should be pretty self-explanatory if you are familiar with matplotlib. Some keywords were less obvious to me so here are a few pointers:
axes.spine.top = FalseThat removes the top line of the plot, set it it to True to bring it back. (Same works for the other spines - line 12 to 15)
axes.grid = TrueThis turns on the the grid in the background; set the False to remove.
axes.prop_cycleThis sets the default colours through which matplotlib cycles as you plot more elements and don’t set the colour parameter. The colour format is a typical hex colour without the hash #. Choose your colours with google’s colour picker and simply copy paste the HEX code!
Step 3: Make it accessible from anywhere
Now if you want to be able to call your style sheet from anywhere on your machine (and not just whatever folder you downloaded it in), you’re going to have to add it to your matplotlib.
My style sheets are located in
~/.local/lib/python3.5/site-packages/matplotlib/mpl-data/stylelibbut your architecture might be different. In bash you can open a terminal in your home directory and run:
find -name “*stylelib*“This may return a few hits if you’ve got multiple python environments installed. Pick the directory corresponding to the environment you’re trying to beautify and go there. You should find there are quite a few style sheets present already, like ggplot.mplstyle or seaborn.mplstyle.
Now simply copy your fancy new style sheet in there, and you’re set! You can now run:
plt.use.style(‘my_awesome_style_sheet')NB: If you want to keep it simple and just have your style sheet in your folder, that’s no problem, but you’ll have to call it with the extension:
plt.use.style(‘my_awesome_style_sheet.mpltstyle')The extra mile
Setting up a new style sheet can be done pretty quickly, but if you want to spend hours really making your plot yours, check the matplotlibrc file at the end of this doc. Most keywords are super intuitive so it is just a matter of going down the list and choosing what you want to personalise.
I’ve gone as far as changing the style of my dashes (mine are round and more spaced), and I know some of you nerds will end up spending hours doing this.